
<<< Go to start <<<
Page 2 of 3 | 1 | 2 | 3 |
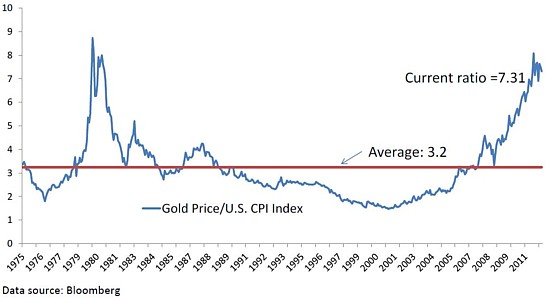
So, here’s the next chart: the real price of gold. It takes account of the consumer price index. With the data starting, again, in 1975, it gives a hint of whether the real price is always going up, as I think many people (without admitting it) often assume. Behind the headlines, however, as the image below suggests, the real price often covertly sneaks south.
The red line in the chart is the average ratio of the nominal price of gold relative to the CPI index, which is one way to calculate the “real price”. So, in 1975, the month-end nominal price of the nearby gold futures contract was $175 an ounce. At that time, the month-end January 1975 index value of the CPI index was 52.1. And this meant that the ratio between them was 3.36 (see bottom left). Geddit?
And, incredibly, this was more or less the average “real price of gold” for the best part of the next four decades.
“… the real price of gold tends to mean revert over a time period of about ten years,” say Erb and Harvey. “The variability of the real price of gold suggests that gold has been a poor short-term inflation hedge.”
Their words, not mine. And worth bearing in mind: “a poor short-term inflation hedge”.
This raises the next question about gold as a valuable asset. If it’s not much use as a short term hedge, maybe we need to go longer.
Gold as a hedge
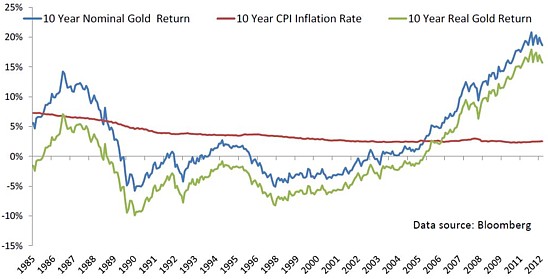
Another Erb and Harvey chart gives insight on this, tracking the (trailing) 10 year nominal gold return, 10 year CPI inflation rates and 10 year real gold returns. And, as you’ll see below, the picture shows no obvious relationship between inflation and gold prices at all. More alarmingly for optimists, the trailing 10-year real gold return was negative between 1988 and 2005.
As the authors conclude: “Gold may not be a very effective long-term inflation hedge when the long-term is defined as 10 years.”
Their words, again, not mine.
So, already the picture is looking gloomy. Or at least more gloomy than gold investors are apt to imagine. With long-term evidence of a return to the mean in terms of what gold is worth compared with other assets, and long periods of negative real returns, the stage is set for the entry of a bubble, and, of course, its exit: an implosion.